
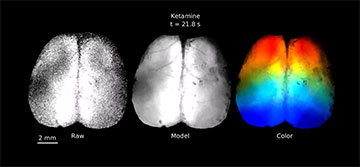
Audiovisualization of neural activity from the dorsal surface of the thinned skull cortex of a ketamine/xylazine anesthetized mouse. [Image: Thibodeaux et al., 2024, PLOS ONE, CC-BY 4.0 (https://creativecommons.org/licenses/by/4.0/)]
Many in vivo neuroscience studies include real-time recordings of both brain activity and behavior during stimulus presentation or task completion. However, comparing two or more video representations at the same time to look for patterns is difficult for the human visual system to achieve.
Researchers at Columbia University, USA, have developed a unique way to represent brain imaging data by translating them into movies with dynamic colors and corresponding music (PLoS One, doi: 10.1371/journal.pone.0297435). This audiovisualization, demonstrated with wide-field optical mapping and swept confocally aligned planar excitation (SCAPE) microscopy, could provide a more intuitive approach to gain insight into complex neuroscience datasets.
Listening to data
In vivo brain imaging techniques include optical methods like wide-field optical mapping, two-photon excitation microscopy and light-sheet fluorescence microscopy, as well as non-optical methods like functional magnetic resonance imaging (fMRI). Both types produce large quantities of multidimensional data that can prove complicated to sift through and match with behavioral recordings.
David Thibodeaux, Elizabeth Hillman and their colleagues at Columbia's Zuckerman Institute decided to add an audio component to traditional video recordings of brain activity, giving researchers the option to “listen” to their datasets while viewing behavioral recordings in parallel. The open-source toolkit is available as a Python-based graphical user interface called PyAnthem (Automated Neuroimaging Timecourse Heuristic Methodology).
“Since the human ear is quite good at processing real-time patterns in music or speech, we felt that it would be a good way to present real-time datasets like these,” said Thibodeaux, who is now with Nikon Instruments, USA. “The combination of hearing the data while also seeing the individual components of it activate as separate colors really helps improve our general understanding of this rapidly changing activity.”
Piano and violin notes
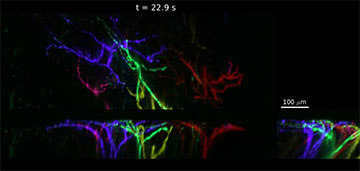
Audiovisualization of SCAPE microscopy data capturing calcium activity in apical dendrites in the awake mouse brain. [Image: Thibodeaux et al., 2024, PLOS ONE, CC-BY 4.0 (https://creativecommons.org/licenses/by/4.0/)]
The audiovisualization workflow consists of four steps. First, the data are represented as a linear combination of temporal and spatial components. Then, a video is created by combining both temporal and spatial components using color-based remixing. Next, an audio stream is generated from the temporal components only, either by directly modifying pure waveforms based on signal amplitude or by converting time courses to MIDI (Musical Instrument Digital Interface) data. Finally, the synchronized audio and video streams are merged into a combined movie.
For example, the researchers started with previously recorded real-time 3D SCAPE microscopy data that captured neurons firing in the awake mouse somatosensory cortex. They converted neuronal events to a MIDI format and represented distinct neural events as percussive piano notes.
Another demonstration used wide-field optical mapping data of both neural activity and hemodynamics across the dorsal surface of an awake mouse. They translated the dataset into a composite movie with a corresponding audio stream, with the faster neural data encoded as piano notes and the slower hemodynamic fluctuations encoded as violin sounds.
“This approach is primarily for screening and presenting data that [are] difficult to show otherwise—especially when there are multiple variables that you need to view at once, such as neural activity and blood flow in our case,” said Thibodeaux. “One next step that we hope to see is that others use this approach to create audiovisualizations of their datasets.”
