
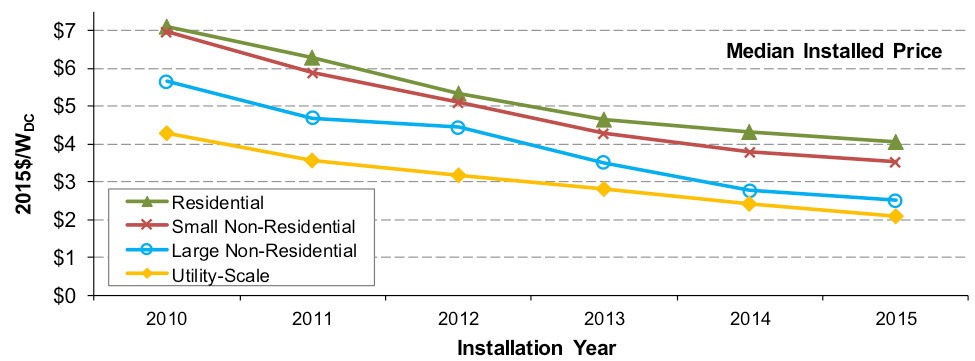
According to the LBNL studies, the median price per watt of installed solar energy in the U.S. has declined across all sectors since 2009. [Image: Berkeley Lab] [Enlarge image]
Recent industry studies have documented rapid growth in megawatts of electricity-generating capacity installed by the U.S. solar-energy industry. Now, two new reports from the Lawrence Berkeley National Laboratory (LBNL) of the U.S. Department of Energy (DOE) suggest that the median prices for those solar installations have continued a long-term trend of decline, moving down 5 percent for distributed and 12 percent on the utility side during 2015.
Distributed solar: “Soft” costs down
One of the LBNL reports, Tracking the Sun IX [PDF], is the ninth installment in a periodic series from the lab that focuses on distributed solar energy (basically, the installed residential and nonresidential market). Analyzing some 820,000 individual photovoltaic (PV) systems—around 85 percent of the cumulative total U.S. installations through 2015—the researchers behind the study documented a median price decline of US$0.20 per installed DC watt for residential systems, a 5 percent dip, and a decline US$0.30/W for both small and large nonresidential systems, a 7 to 9 percent reduction.
The declines continued a six-year trend of price declines in installed solar—but the dynamics driving the declines seem to be shifting, at least in the U.S. In the years through 2012, annual price declines stemmed largely from falling prices in PV modules themselves. But since then, module prices have largely been flat. Instead, the recent LBNL study ties much of the year-to-year price decline for 2015 to decreases in “soft” costs such as marketing, system design, and installation labor, as well as to lower costs for some non-module equipment such as racks and inverters.
Interestingly, despite this long-term decline in U.S. distributed-solar costs, the study notes that U.S. costs remain far higher than those in most other national markets—residential-system costs, for example, typically weigh in at around US$1.70/W in Germany, versus a median installed price of US$4.10/W in the United States. Also, the report noted substantial geographical price variation within the United States itself, with higher-than-median prices in some states, such as California, Massachusetts and New York, which represent particularly large markets for solar. And installations that include high-efficiency PV modules seem to be able to command a significant price premium.
Utility solar: Trending toward tracking
The other LBNL report, Utility-Scale Solar 2015 [PDF], was the fourth in an annual series from the lab looking at ground-mounted solar installations with more than 5 megawatts in AC capacity. That sector has led the market for solar installations in capacity terms since 2015, and the report’s authors note that the trend should continue for at least the next three years, owing to the extension of the federal investment tax credit in the United States.
Installation pricing for utility-scale projects, meanwhile, mirrored the declines in the distributed-solar sector, with the median cost falling $0.30/W, or 12 percent year to year, in 2015. The 2015 median cost was, in fact, down 60 percent from its 2007-2009 levels, a stunning six-year drop.
The report also documented interesting trends in the variables driving utility PV “capacity factors”—a measure that compares the installation’s actual performance in use with its theoretical full-bore capabilities. In particular, an increasing number of new installations, particularly those using thin-film PV technology, are including solar tracking devices (usually single-axis systems) that allow the installed panels to follow the sun’s arc across the sky. Installers have also increasingly been “oversizing” solar arrays in their designs, loading more DC power from the PV modules into a given AC inverter to handle peak periods. These and other changes have boosted capacity factors from 21.0 percent for projects that began operation in 2010 to 26.7 percent for projects that opened for business in 2015.
Both reports were funded by DOE’s SunShot Initiative, which has the stated goal of making solar energy cost competitive with other forms of electricity generation by the end of the decade.