
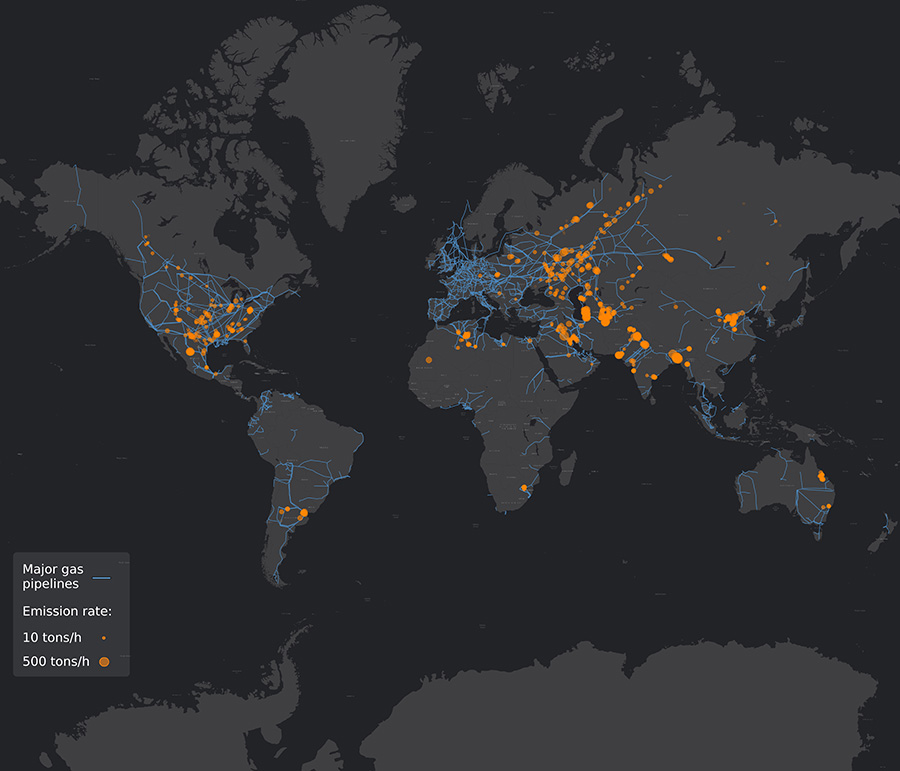
Using imaging-spectrometer data from the TROPOMI instrument onboard the Sentinel-5P satellite, a multinational group has created a map of methane “ultra-emitters,” many of them associated with oil and gas production. Orange dots show emission point sources and size of emission; blue lines are major gas pipelines. [Image: © Kayrros Inc., Esri, HERE, Garmin, FAO, NOAA, USGS, OpenStreetMap contributors, and the GIS User Community] [Enlarge image]
One of the more practical outcomes of November’s UN COP26 climate conference was broad commitment to the Global Methane Pledge. That pact, ultimately signed onto by more than 100 countries, constitutes a vow to slash worldwide emissions of methane, one of the most potent greenhouse gases, by at least 30% between 2020 and 2030.
But getting a fix on total anthropogenic (human-caused) methane emissions has been a slippery proposition. Indeed, it’s been known for years that current estimates of such emissions are likely significantly below the actual total. That’s partly because the contribution from one big potential methane source—periodic, large leaks or accidental releases at production sites of the oil and gas industry—is incompletely understood.
Now, scientists in France and the United States have obtained a clearer view of the contribution by these so-called methane ultra-emitters (Science, doi: 10.1126/science.abj4351). They achieved the feat by crunching huge volumes of data from an imaging spectrometer, the Tropospheric Monitoring Instrument (TROPOMI), that’s been circling the Earth aboard the European Space Agency’s Sentinel-5P satellite since late 2017.
The team’s methane map indicates that the ultra-emitters belch out somewhere on the order of 8 million tonnes of methane worldwide per year—equivalent, in warming potential, to the greenhouse-gas emissions of 20 million road vehicles. But there’s good news, too: The authors of the study suggest that targeting and cutting methane leaks from these big emitters should be comparatively easy now that they’ve been identified and mapped.
Big climate punch
Methane (CH4), though less abundant in the atmosphere than carbon dioxide (CO2), packs a significant punch in climate change. Molecule for molecule, methane is some 30 times as effective as CO2 in trapping heat in the atmosphere. Unlike CO2, however, which stays in the atmosphere for 300 to 1,000 years or more, methane has a comparatively brief atmospheric lifetime—12 to 15 years.
Methane, though less abundant in the atmosphere than carbon dioxide, packs a significant punch in climate change.
Thus methane emission cuts could have a significantly greater near-term impact on atmospheric concentrations—and warming—than CO2 reductions. That fact has led policy-makers to put methane emission reductions at the top of the agenda in addressing climate change, and has provided a strong incentive to determine where those emissions are coming from.
While anthropogenic methane emissions derive from many sources, around one-quarter originate in worldwide fossil-fuel extraction. Measuring those contributions, however, has been tricky. Historically, it has relied heavily on amassing data from local sensors and periodic airborne surveys. Data on sporadic large emissions—intermittent leaks or other emission events of 25 tonnes per hour or more—can only come from satellite observations, and such data on methane have been sparse until recently.
TROPOMI sniffs out methane
Closing the satellite data gap on methane was a key science goal of TROPOMI, an imaging spectrometer that was lofted into Earth orbit in October 2017 as part of the Sentinel-5P mission. The TROPOMI instrument includes four detectors that take measurements in different spectral bands in the UV, visible (270-500 nm), near-infrared (675-775 nm) and shortwave infrared (2305-2385)—the latter band being a sweet spot for picking up methane. It images with a spectral resolution of 0.25 to 0.55 nm, and a spatial resolution of around 7×3.5 km.
That’s a considerably tighter pixel size than some earlier satellites, and gives TROPOMI the potential for picking up big emissions at individual industrial sites. As Sentinel-5P plows through its orbit, TROPOMI images the Earth pushbroom-style, taking in a 2600-km-wide swath of data every second. According to ESA, that swath width, coupled with Sentinel-5P’s orbital period, means that satellite is capable of mapping the entire Earth’s surface every day.
Mapping 1,800 methane plumes
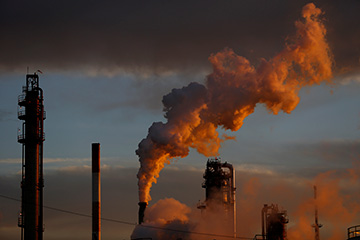
The analysis of the TROPOMI data enabled an inventory of some 1,800 large-volume methane plumes, around two-thirds of which were associated with oil and gas production. [Image: Bloomberg Creative Photos/Getty Images]
The team behind the new work—led by researchers from the France-based Laboratoire des Sciences du Climat et de l’Environnement and the data-analytics firm Kayrros, and including workers from several other French and US institutions—has now rolled the raw TROPOMI data into a potentially actionable map of methane ultra-emitters. To do so, the team systematically analyzed many thousands of TROPOMI images collected between 2019 and 2020. In particular, the researchers applied machine-learning algorithms and high-resolution modeling to pick out and quantify individual methane plumes from large emitters, and to correct for plume overlap and other atmospheric complications.
The team’s analysis of the two years of TROPOMI spectrometer data resulted in a map of more than 1,800 methane plumes of 25 tonnes/hour or more worldwide—two-thirds of them tied to oil and gas extraction. Many of the ultra-emitters were clustered around big gas transmission pipelines and in the largest exploration basins for oil and gas. The six countries with the highest emissions were Turkmenistan, Russia, the United States, Iran, Kazakhstan and Algeria.
A quick climate win?
The authors of the new study calculate that eliminating the emissions from these ultra-emitters would be equivalent to “removal of 20 million vehicles from the road for one year” in terms of its impact on planetary warming. The team also suggests that the map provides a tool for a potentially quick win in the climate-change battle. “By nature,” the authors write, “reducing these ultra-emitters by enforcing leak detection and repair strategies or by reducing venting during routine maintenance and repairs provides an actionable and cost-efficient solution for emission abatement.”
With three more years in TROPOMI’s original design lifetime, data from the instrument will continue to inform the methane-monitoring effort for a while longer. And the Sentinel-5P mission is slated to be followed up by a fleet of new monitoring satellites with even better resolution—as tight as 400 m2 or less. Even so, these observations will need to be complemented with observations from ground-based and drone-based sensor networks to get a full methane picture that can inform policy decisions.
