

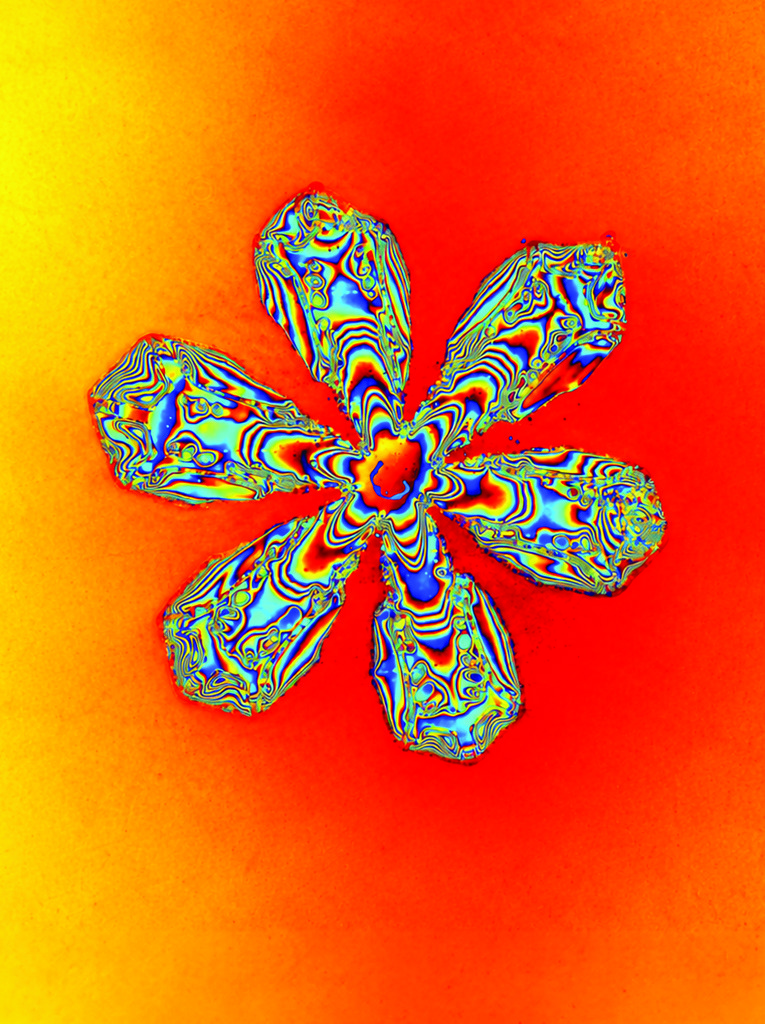
Snowflake in Phase
A melting snowflake is shown as a quantitative phase map in which color encodes the optical path length of light through the crystal, proportional to its thickness. The densely packed color fringes are contours of equal thickness that trace the 3D relief of the dendritic arms, while the smoothly varying background records the nanometer-scale water film on the substrate. A laser beam illuminates the sample directly, with no lens anywhere in the system. A coded surface on the image sensor’s cover glass acts as a computational lens for ptychographic reconstruction. [Ref: Nat Commun., doi: 10.1038/s41467-026-75092-8]
—Guoan Zheng, University of Connecticut, Storrs, CT, USA
