
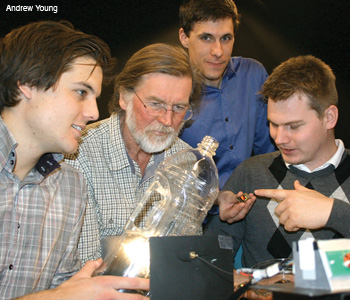
Optical engineers at TOMRA assembled around a test bench in the lab. From left: Tord Bjørnevaagen Brandsæter, Andreas Nordbryhn, Marco Schade and Hans Einar Øverjordet.
Andrew Young
In 1972, my company, Tomra, was founded on the idea of constructing so-called reverse vending machines—which would buy back empty used bottles in stores and supermarkets for reuse by beverage bottlers. This was before the global green revolution, and at that time we saw the initiative mainly as a practical way to help store personnel in Norway. Back then, bottles were mostly made of glass, and they were intended to be refilled and reused multiple times.
Today, of course, the importance of conservation is well known around the world as we face the potential climate implications associated with burning fossil fuels. Thus, our initial business concept has taken on a whole new meaning. The idea of reverse vending machines caught on, and over time a number of companies entered the market. Three of the current players are Envipco from the United States, Wincor Nixdorf in Germany and Tomra in Norway. Together, we are now all important contributors to the recycling business, and our work is classified as “green” industry.
In modern households, cans made of steel or aluminium, and bottles made of glass or plastic, can represent up to 40 percent of the total volume of waste. With many different types of materials to differentiate among—and myriad ways in which they are recovered and repurposed—the industry has had to produce sophisticated tools for identifying and sorting through waste, most of which are based on optical technologies.
History of the industry
The early reverse vending machine (RVM) industry was based on developing, producing, selling and operating automatic machines that bought back empty bottles in order to have them cleaned and refilled by breweries and bottlers. The glass bottles that were commonly used at that time were considered to be of some value. The compensation given per bottle was comparable to the cost of making a new one, and this incentivized people to return bottles to the store where they had been bought.
In order for an RVM to recognize acceptable bottles, it had to be able to make a fairly accurate shape measurement. A range of optical techniques have been used to do this over the years. Some early systems had photocells positioned beside a transport conveyor for the bottles, or their contour was measured by laser scanners. Today the shape of the bottles is most often measured using a CCD or CMOS camera.
Often beverage bottles are sold in crates, and the empty bottles are in turn returned that way. This is common in several European countries. For example, German beer is still most often distributed to consumers crate-by-crate in refillable glass bottles. Industry scientists developed solutions for taking in, recognizing and paying out the correct deposit for entire crates.
To do this, the sorting tool had to be able to do a complete 3-D characterization of the crate, since there are several thousand different crate shapes to distinguish among. In the 1980s, this was partly done by using an ultrasound scanner inside the instrument. In 1990, we introduced a laser range-finder scanning machine, which generates a complete height profile of the crate by measuring the phase shift of the modulation of a reflected laser beam. This phase shift is proportional to the light time of flight.
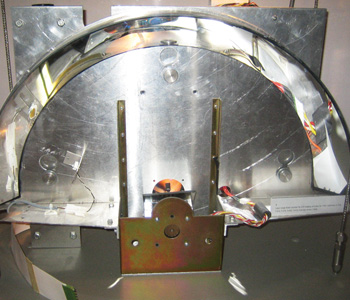 A 3-D crate imager based on a scanning laser range finder. The diameter of the scan arc is 50 cm.
This proved to be faster and more accurate than the ultrasound machine, and it soon became the industry standard. Nowadays, however, the laser scanning technology is being replaced by stereo vision systems that use two cameras combined with image post-processing, which are a lot more accurate and reliable. In addition to being able to recognize bottle shapes, camera systems can be used to control the flow of objects through the machines and to reveal attempts to cheat them.
The last machines of the laser scanner generation were manufactured and installed with customers in early spring 2012. There are some 20,000 RVMs based on laser scanning technologies deployed in European supermarkets today.
After one day of operation, a typical RVM for refillables has collected large numbers of bottles and bottle-filled crates. Most often, the machines are equipped with some back-room storage facilities to contain all of this.
During the 1980s, RVM technology evolved to keep up with changes in the beverage industry. As drinks were increasingly packaged and sold in so-called single-use containers—mostly metal cans and plastic bottles that were used once and then recycled—markets were established to create a deposit system for these products, and we soon developed RVMs for them as well.
New sensors recognized new containers. In large part, single-use containers could be identified just by reading the bar code on the package, so the new RVMs were equipped with tailored bar code readers, which were mostly based on laser-scanner technology. Over the past few years, camera-based bar code readers have become increasingly common, although laser scanners remain more prevalent. Cameras have become a competitive technology due to the evolution of low-cost, high-resolution camera chips and low-cost computer processing power in compact packages.
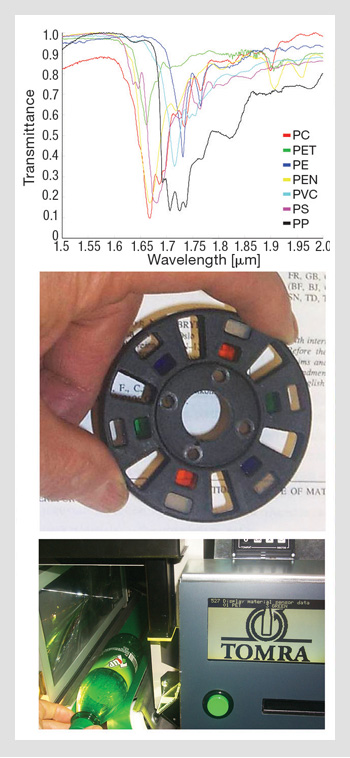 This unit uses a filter wheel with six polymer pieces as the spectrally discriminating element. (Top) Representative spectra of various polymer materials between 1.5 and 1.8 µm (characteristic spectral range of many collectable polymers). (Center) The filter wheel itself (Bottom) Entrance area of a reverse vending machine with the material detector.
While refillable containers must be handled with care, one-way containers are typically crushed and sorted by the RVM to increase the storage capacity and ease the handling of collected materials.
Many global markets include a mix of reusable and one-way drink containers. For that reason, most RVMs are equipped to accept both types, and they need all sensor types to do so. To date, Tomra has installed approximately 67,000 RVMs in 10 U.S. states with mandatory deposit laws plus more than 20 other countries, mostly in Europe.
In a few countries, government authorities have required that bottles be made with secret, secure marks that must be recognized in order to ensure that they are genuine deposit items. The deposit put onto these bottles is a lot higher than their material value. The marks have combined graphic and spectral features that are recognized using tailored cameras, light sources and image-processing algorithms.
Non-deposit markets
In markets that offer a deposit on used drink containers, the recycling rate is often higher than 90 percent, and the purity of the materials collected is close to 100 percent. The key to this success is the financial incentive given to consumers for doing a little extra work to bring the empties back to a collection point where they are easily recognized and sorted.
Interestingly, even in a deposit-based system, not all containers are returned. This creates a profit: If 90 percent of containers are returned (which means that it is a very successful method), 10 percent of the deposit collected when the drink bottles are purchased will reside in the deposit system. This turns out to be a substantial sum of money, and one that is large enough to cover the cost of the required equipment and operation. There is a beautiful logic to this: The cost to run the operation is, to a large extent, carried by the individuals who choose not to participate.
However, today only 15 percent of the world’s drink containers offer a return deposit. Collection systems that don’t offer a deposit (igloos, curbside collection, etc.) rarely manage to reach a 50 percent consumer return-rate, and the collected items include all sorts of “wrong” materials, necessitating a thorough additional sorting. Thus, these collection schemes are invariably expensive.
Increasing the number of deposit-based systems has proved to be a political challenge. Therefore, Tomra and other companies are focusing their efforts on identifying possible tools to make successful recycling systems that are not based on return deposits.
In order to create a viable business model in the absence of deposit money, it is essential to squeeze costs and operate as efficiently as possible. The main resource we have to work with is the value of the material, and the major expense is the cost of transporting the material after it is collected. Thus, one of our strategies is to collect as much material as possible, sort it 100 percent clean according to material type, and densely compact each fraction into easily transportable bins. The material commodity market is willing to pay a good price for these filled bins.
REDUCE, REUSE, RECYCLE: A glossary of termsThe governments in most developed countries have passed laws to promote reduction, reuse and recycling. Recovered materials can be handled in a number of ways. REUSE Examples: Washable napkins; reusable coffee cups and plates; cloth grocery bags. RECYCLING Examples: Aluminum cans that are melted and recast; plastic bottles that are granulated, cleaned and remade; PET (polyethylene teraphtalate) plastics that are made into polyester textiles. DOWNCYCLING Examples: Crushed glass used as landscape-filling material, plastic from bottles that is used as flooring material or park benches. ENERGY RECOVERY Examples: Electricity generation through incineration; producing a combustible gas from waste; anaerobic digestion of material by microorganisms to release energy. DISPOSAL |
Low-cost spectroscopy
Optics plays a key role in sorting materials. Metals such as steel and aluminum are easily separated using electromagnetic tools. Plastics, on the other hand, pose quite a challenge: Many different types are used, and they must be separated in order to create a high value. The solutions that the industry has developed involve near-infrared spectroscopy. Many of the collectable polymer materials have characteristic transmission spectra between 1.5 and 1.8 µm.
Between 1999 and 2009, researchers developed two generations of very low cost sensors based on these spectral properties. The earliest of these used a principle of correlation spectroscopy with a series of ordinary plastic materials as the wavelength-discriminating elements. The instrument consists of a broadband light source directing its radiation toward an InGaAs detector; a 2,850-K halogen lamp works just fine. The detector is sensitive within the desired infrared spectral range of 1.5 to 1.8 µm. The plastic object to be recognized, and a spinning filter wheel with six polymer materials, sits between the source and the detector. When the six filters get into the light path in succession, the detector reads a sequence of signal pulses of varying height.
As it turns out, when the choice of polymer materials in the filter wheel has been properly made, any polymer type in the bottle under test presents a unique and recognizable sequence of signal peaks. In addition to the polymer recognition path, the filter wheel also has three color filters (red, green and blue). A silicon detector is placed beside the infrared detector, allowing for a proper color measurement of the bottle material.
In spite of the simplicity and efficiency of this technique, Tomra scientists worked to develop an even more flexible, powerful and lower cost tool. It combines synthetic holography and spectrometry. A planar diffractive optical element (DOE) enables three functions in one: focusing, wavelength dispersion and multiple beam-splitting. The shape of a hologram can be calculated to give all these functions, and a master is produced with electron beam lithography. Injection molding is used to create copies of the master. After a bit of trial and error, we found that this tool worked beautifully.
Several R&D institutions have assisted Tomra in this process: SINTEF, a Norwegian research institute, created the principal design and calculated the desired hologram shape; the MC2 lab at Chalmers University in Gothenburgh, Sweden, did the master producing electron beam lithography; and Åmic, a Swedish high-accuracy injection molding company, did the high-volume copying.
The design of this type of component allows flexibility, and over the past few years different versions have been introduced for various applications, using wavelengths ranging from the ultraviolet through the visible and near-infrared and up to the 10 µm infrared range. Focal length is a design parameter, as are the number of split-out spectra and the relative position of these spectra created in the focal plane.
In the spectrometer that we use to recognize different plastics, we pass radiation from a broadband source in the 1.5 to 1.8 µm range (e.g., a halogen lamp) through the unknown sample, hitting an optical fiber entrance. The exit of this fiber is positioned in a first focal plane of the DOE and directed towards it. In the second focal plane, the point light from the fiber is dispersed and split into five parallel focused spectra.
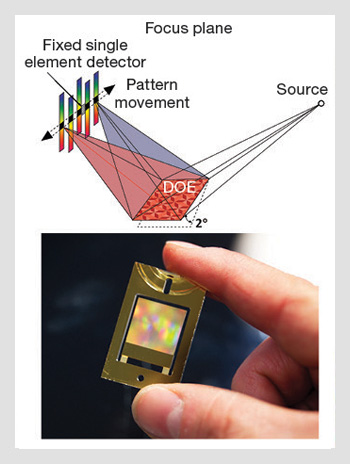 (Top) The DOE is a flat, reflective patterned surface that functions as a beam splitter, band pass filter and focusing lens at the same time. Incident white light from the source is diffracted into five focused spectra in a plane containing a single element detector. When the DOE is scanned about an axis, the pattern moves across the detector position; in this way, the detector “sees” five wavelengths in succession during a half stroke of movement. (Bottom) DOE used for plastic recognition; area, 13 x 14 mm.
The DOE is mounted on a steel spring and, with the help of a magnetic coil, it is made to vibrate at an angle of about two degrees at a frequency of about 80 Hz. The vibrating direction is such that the five spectra are moved back and forth in a direction perpendicular to that of the wavelength variation. A single element detector is positioned in the focal plane such that one point in each of the spectra in turn passes across the detector. By design of the DOE, it is possible to displace the spectra relative to each other so that the detector in turn sees the position of five different wavelengths. By considering the spectra of the various materials to be separated, one can select wavelengths for optimal separation.
Once a proper master has been made, copies can be molded much like polycarbonate CDs. Therefore, the cost of this kind of plastic separation can be very low. The most expensive component is often the detector, especially if the application is in the infrared range. In addition, some signal processing is required. In any case, there is a computer available in the machines in question, so the cost for the spectrometer signal processing can be almost nonexistent.
Due to the rather high thermal expansion index of plastics, including polycarbonate, there is a shift of the wavelengths measured when the temperature changes. In some applications this is undesirable. When we tried to model, fabricate and test synthetic hologram elements in silicon, we found a much more stable behavior with changing temperatures. To produce this, we used a four-level lithography process, partly made at the Fraunhofer IPM in Dresden, Germany, and partly at SINTEF in Oslo, Norway.
This type of silicon DOE spectrometer has been running and working reliably in about 100 large automatic recycling centers in England and Scotland on supermarket parking places over the past five years. Implementations for other purposes are also in use in gas detectors and biomedical analyzers, and even more applications are under development.
Not-so-low-cost spectroscopy
Most recycling efforts are based on a certain degree of participation by consumers. But not everyone wants to contribute, and not all markets have systems that make it easy. An inevitable consequence is a municipal waste stream that contains valuable material resources: metals and plastics. Sadly, in many parts of the world, this ends up as landfill—a real waste!
To address this, a number of markets have introduced so-called material recovery facilities (MRFs). Here, various optical sensors are used in huge central trash handling centers to recover large fractions of valuable material. The high end of these facilities do spectral imaging over a 2-m-wide conveyor running at high speed, getting NIR and visible spectra with a spatial resolution of 2.5 cm, making them able to sort up to 30 tons of waste per hour.
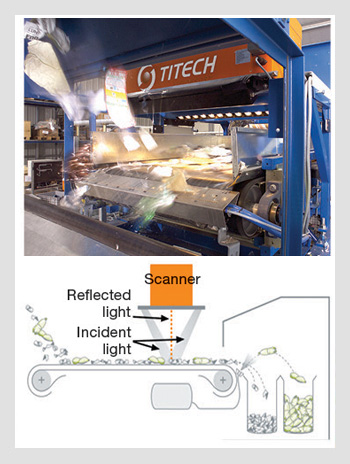 (Top) MRF running at full speed, sorting valuable materials from a municipal waste stream. (Bottom) Incident light is generated by a number of reflector halogen lamps. Reflected light is imaged and spectrally analyzed in the scanner.
In this way, they can sort various types of paper and cartons as well as a number of plastics. These numbers are managed by more traditional and higher-cost spectrometric instrumentation than what is used in RVMs. But since the MRFs are very large installations—each capable of sorting out large amounts of valuable materials—this cost is not a problem.
The materials generated from these large waste-sorting facilities are very similar to those that come more directly from consumers through RVMs. Key materials include aluminium and PET (polyethylene teraphtalate) plastic, both of which are traded on the world’s commodity markets. The current price level for aluminium is $1.30-$2.20/kg and for PET plastic is $1.30-$1.60/kg. Aluminum is easily melted and recast into new drink cans or other items. PET plastic is commonly turned into fiber and used for Polar Fleece and other fabrics. A large fraction is also made into new PET bottles, thus creating a closed loop for the material.
Creating a sustainable future
Today it requires 1.5 years to reproduce the biomass that the world consumes in just one year. Something must change if we want to create a sustainable future. We must rethink how we obtain, use, reuse and optimize the world’s resources. Recently, an initiative called LAUNCH was set up by NASA, USAID, the U.S. Department of State and Nike in order to identify innovative solutions.
This summer, LAUNCH will stage a forum called “Beyond Waste” to identify game-changing innovations that can improve waste handling. Sensor-based sorting to increase resource productivity must be part of the solution. It is increasingly used across several sectors: to generate resources (e.g., ore sorting in mining), to use resources (e.g., food quality sorting) and to reuse resources, as I have described here.
Optical engineers are making important contributions: Sensor-based sorting systems can enable optimal resource productivity in a cost-effective fashion. When everything is done right, companies do not have to choose between environmental or economic gains—they can achieve both simultaneously. It’s a green business, indeed.
|
Applied Industrial Optics This article is based on a paper presented by the author at OSA’s Applied Industrial Optics Congress. Now in its third year, the Congress explores optical technologies that have been successfully applied to industrial applications as well as cutting-edge advances in optical components or systems in applied fields. To register for this year’s meeting, visit www.osa.org/aio. |
Andreas Nordbryhn is the chief scientist at Tomra Systems ASA, Asker, Norway.
References and Resources
>> Global Footprint Network
>> Tomra
>> Envipco
>> Sorepla
>> The LAUNCH project
>> Patents that describe sensors in detail: U.S. 3,955,179; U.S. 4,055,834; DE 19512133; U.S. 4,322,016; U.S. 4,996,440; U.S. 7,055,629; U.S. 6,006,995; U.S. 6,433,338; U.S. 7,701,574; U.S. 6,914,678.
>> O. Løvhaugen et al. “Dedicated spectrometers based on diffractive optics: design, modeling and evaluation,” J. Mod. Opt. 51, 2203-22 (2004).
>> H. Angelskår et al. “Spectral uniformity of two- and four-level diffractive optical elements for spectroscopy,” Opt. Express. 17(12), 10206-22 (2009).
>> I-R Johansen et al. “Low cost silicon based spectrometers for polymer recycling,” 3rd EOS Topical Meeting on Optical Microsystems (2009).